"Explanation of everything you can see in htop/top on Linux"
“解释你在Linux 上htop/top 中看到的所有内容”
- 原文地址:
- https://peteris.rocks/blog/htop/
- 遵循原文许可协议:Apache 2.0 license
- 作者:Pēteris Ņikiforovs
- 原文修订时间:January 2, 2017
很长一段时间我都不清楚htop 中所有内容的意思。
我曾经以为我的双核机器上1.0的平均负载意味着CPU 利用率是50%。这并不完全正确。而且,为什么是1.0呢?
我决定查清楚,并记录成这份文档。
大家也都说,学习事物的最好方式是通过教别人。
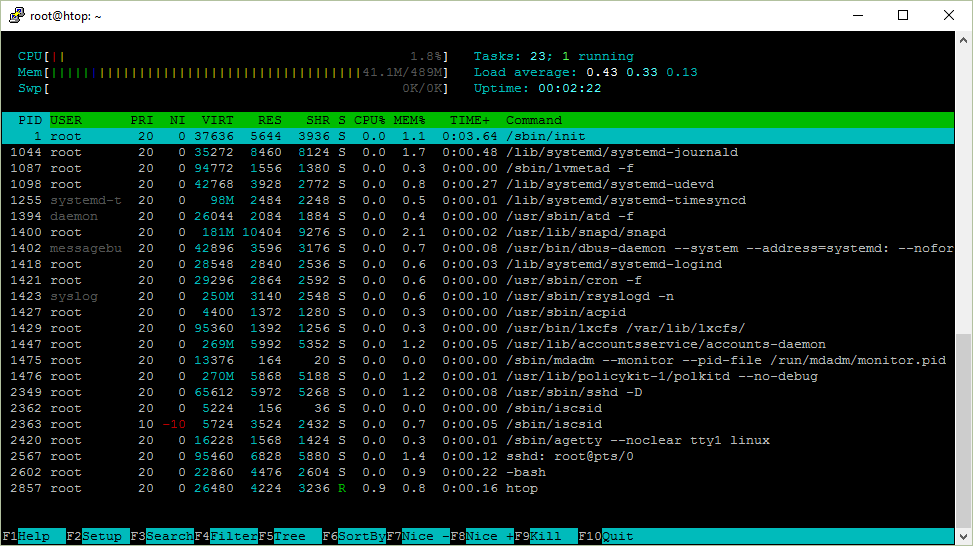
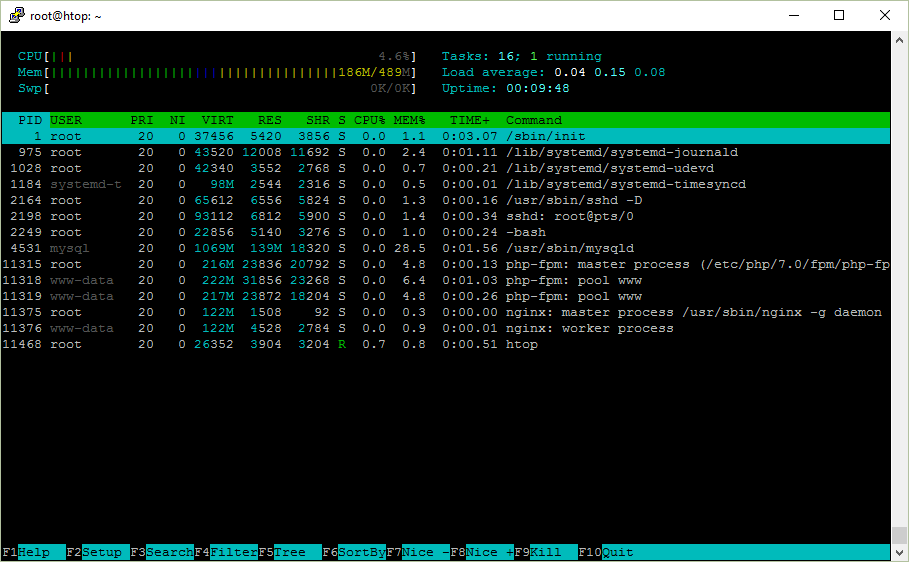
Ubuntu Server 16.04 x64 上的htop
这是一张我要解释的htop 截图。
Uptime
Uptime 显示系统已经正常运行了多久。
你可以通过运行uptime 命令看到同样的内容:
$ uptime
 12:17:58 up 111 days, 31 min,  1 user,  load average: 0.00, 0.01, 0.05
uptime 程序是怎么获取这些信息的?
它是从/proc/uptime文件中读取这些信息。
9592411.58 9566042.33
第一个值是系统总共已经运行的秒数。第二个值是机器空闲的总秒数,在多核机器上第二个值可能某些时刻会大于系统总体的运行时间,因为它是多个核心的总空闲时间。
我怎么知道的?我查看了uptime 程序运行的时候打开了哪些文件。我们可以用strace 工具来跟踪。
strace uptime
执行上述命令会得到一大堆输出。我们可以使用grep 过滤出open 的系统调用。但是这样不会起作用,因为strace 会把所有内容输出到标准错误(stderr)流。我们用2>&1可以把标准错误输出重定向到标准输出(stdout)流。
我们得到的输出如下:
$ strace uptime 2>&1 | grep open
...
open("/proc/uptime", O_RDONLY)          = 3
open("/var/run/utmp", O_RDONLY|O_CLOEXEC) = 4
open("/proc/loadavg", O_RDONLY)         = 4
其中包含我提到的/proc/uptime文件。
其实你也可以用strace -e open uptime,不必用grep 过滤。
所以,如果我们可以从这些文件中读取内容,为什么还需要uptime 程序呢?这是因为uptime的输出格式对人来说更友好,不过在你的程序或者脚本里还是使用秒数方便一些。
平均负载
除了正常运行时间,另外还有三个数值表示平均负载。
$ uptime
 12:59:09 up 32 min,  1 user,  load average: 0.00, 0.01, 0.03
它们是从/proc/loadavg文件中读取的。如果你再看一眼strace的输出,你也可以看到这个文件被打开了。
$ cat /proc/loadavg
0.00 0.01 0.03 1/120 1500
前三列数分别表示系统最近1分钟,5分钟和15分钟的平均负载。第四列数表示目前正在运行的进程数和总进程数。最后一列显示了最近一次运行的进程ID。
让我们从最后一个数开始。
你每次启动一个新进程时,都会被分配一个ID 号。进程ID 通常是逐渐增大,除非它们已经耗尽,并被重复使用。进程ID 1 属于/sbin/init,它会在系统启动的时运行。
在看一遍/proc/loadavg的内容,并在后台执行sleep命令。当它在后台启动时,它的进程ID 会显示出来。
$ cat /proc/loadavg
0.00 0.01 0.03 1/123 1566
$ sleep 10 &
[1] 1567
所以1/123 意味着这一刻只有一个进程在运行,并且总共有123个进程。
当你运行htop 时,只看到只有一个正在运行的进程的话,这个进程就是htop 自身。
如果你执行sleep 30,然后再次运行htop,你会看到还是只有一个正在运行的进程。这是因为sleep没在运行,它正处于休眠或空闲状态,或者说是在等待某事发生。一个正在运行的进程的定义是当前正在某个物理CPU 上运行,或者等待调度到CPU 上运行的进程。
如果你执行cat /dev/urandom > /dev/null,这个命令会不断生成随机的字节,并写入到一个特殊的无法被读取的文件,你将会看到有2个正在执行的进程。
$ cat /dev/urandom > /dev/null &
[1] 1639
$ cat /proc/loadavg
1.00 0.69 0.35 2/124 1679
这样现在有2个运行中的进程(随机数生成和读取/proc/loadavg内容的cat),同时你也会注意到平均负载升高了。
平均负载表示一段时间内系统的平均负载。
负载是通过统计运行中的进程(正在运行或者等待运行)和不可中断(uninterruptible)进程(等待磁盘或网络的相应)数量计算得到的。简单来说是一些进程的总数。
所以平均负载是最近1分钟,5分钟和15分钟内这些进程的平均数,对吗?
实际上没这么简单。
平均负载是负载的指数移动平均。摘自维基百科:
从数学上来讲,这三个值都是系统起来以来的平均值。它们都是指数级衰减的,不过衰减速度不同。因此,1分钟的平均负载是63% 的最近一分钟的负载,再加上37%的系统启动以来除去最近一分钟的负载得到的。所以,1分钟的平均负载只包含最近60秒的情况从技术上看是不准确的(因为它还包含了过去37% 的情况),只是大部分是最近一分钟的情况。
(译注:Load (computing),移动平均 )
这是你意料之中的吗?
让我们再看看我们的随机数生成:
$ cat /proc/loadavg
1.00 0.69 0.35 2/124 1679
尽管从技术上看是不准确的,但是为了便于理解,还是把平均负载简单化。
在这个例子中,生成随机数的进程是CPU 密集型(CPU Bound),所以最近一分钟的平均负载是1,或者说最近一分钟平均有1个正在运行的进程。
因为我的系统上只有一颗CPU,一颗CPU上同一时刻只能运行一个进程,所以CPU 利用率是100%。
如果有2个核心,CPU 利用率将会是50%,因为同一时刻可以运行2个进程。2个核心的计算机的CPU 利用率达到100% 的话,它的平均负载会是2.0。
你可以在htop 左上角或者执行nproc 命令,看到你的CPU 核心数。
因为负载数还包括出于不可中断状态的进程,但是这些进程不会太影响CPU 利用率,所以从平均负载推断CPU 利用率不太准确。这也解释了你可能遇到过的平均负载很高但是CPU 不忙的情况。
不过也有一些例如mpstat 这样的工具可以显示即时的CPU 利用率。
$ sudo apt install sysstat -y
$ mpstat 1
Linux 4.4.0-47-generic (hostname)   12/03/2016      _x86_64_        (1 CPU)

10:16:20 PM  CPU    %usr   %nice    %sys %iowait    %irq   %soft  %steal  %guest  %gnice   %idle
10:16:21 PM  all    0.00    0.00  100.00    0.00    0.00    0.00    0.00    0.00    0.00    0.00
10:16:22 PM  all    0.00    0.00  100.00    0.00    0.00    0.00    0.00    0.00    0.00    0.00
10:16:23 PM  all    0.00    0.00  100.00    0.00    0.00    0.00    0.00    0.00    0.00    0.00
# ...
# kill cat /dev/urandom
# ...
10:17:00 PM  all    0.00    0.00    0.00    0.00    0.00    0.00    0.00    0.00    0.00  100.00
10:17:01 PM  all    1.00    0.00    0.00    2.00    0.00    0.00    0.00    0.00    0.00   97.00
10:17:02 PM  all    0.00    0.00    0.00    0.00    0.00    0.00    0.00    0.00    0.00  100.00
那为什么我们还要使用平均负载呢?
$ curl -s https://raw.githubusercontent.com/torvalds/linux/v4.8/kernel/sched/loadavg.c | head -n 7
/*
* kernel/sched/loadavg.c
*
* This file contains the magic bits required to compute the global loadavg
* figure. Its a silly number but people think its important. We go through
* great pains to make it work on big machines and tickless kernels.
*/
(译注:总的来说,平均负载十分愚蠢, tickles 内核参考:无嘀嗒内核),Linux Tick 和 Tickless
进程
htop 右上角显示了进程总数和运行中的数量,不过它显示的是任务(Task)而不是进程,这是为什么呢?
进程的另一个名字是任务。Linux 内核内部把进程称为任务。htop 使用任务(Task)来代替进程(Process)可能是因为它(Task)更短,更节省屏幕空间。
你可以在htop中看到线程。按下Shift和H 键可以切换到显示线程的模式。如果你看到Tasks: 23, 10 thr,即显示了线程。
你也可以看到内核的线程,按下Shift和K键。它们会显示的是Tasks: 23, 40 kthr。
进程 ID / PID
每次新建一个进程的时候,都会分配给它一个标识的数字(ID),也称为进程ID 或简称为PID。
如果你在bash 里运行一个后台(&)的程序,你会看到方扩号里的任务号和PID。
$ sleep 1000 &
[1] 12503
如果你错过这些内容,在bash 里面可以用$!这个变量,它会显示最近的后台进程的ID。
$ echo $!
12503
进程ID 非常有用。可以用它来查看进程的细节和控制进程。
procfs 是一个虚拟文件系统,用来让用户程序通过读取文件获取内核的信息。procfs通常挂载在/proc/,对你来说,它看起来想一个普通的文件目录,你可以使用ls和cd进行浏览。
所有关于一个进程的信息都在/proc/<pid>/。
$ ls /proc/12503
attr        coredump_filter  fdinfo     maps        ns             personality  smaps    task
auxv        cpuset           gid_map    mem         numa_maps      projid_map   stack    uid_map
cgroup      cwd              io         mountinfo   oom_adj        root         stat     wchan
clear_refs  environ          limits     mounts      oom_score      schedstat    statm
cmdline     exe              loginuid   mountstats  oom_score_adj  sessionid    status
comm        fd               map_files  net         pagemap        setgroups    syscall
举个例子,/proc/<pid>/cmdline 包含运行这个进程所用的命令。
$ cat /proc/12503/cmdline
sleep1000$
额,不对。实际上这个命令是以\0字节分隔的。
$ od -c /proc/12503/cmdline
0000000   s   l   e   e   p  \0   1   0   0   0  \0
0000013
我们可以用空格或者换行符替换\0。
$ tr '\0' '\n' < /proc/12503/cmdline
sleep
1000
$ strings /proc/12503/cmdline
sleep
1000
一个进程的目录可以包含链接!例如,cwd指向当前的工作目录,exe指向可执行的二进制文件。
$ ls -l /proc/12503/{cwd,exe}
lrwxrwxrwx 1 ubuntu ubuntu 0 Jul  6 10:10 /proc/12503/cwd -> /home/ubuntu
lrwxrwxrwx 1 ubuntu ubuntu 0 Jul  6 10:10 /proc/12503/exe -> /bin/sleep
这就是htop,top,ps和其他诊断工具获取进程详细信息的方式:
都是通过读取/proc/<pid>/<file>的内容。
进程树
当启动一个新进程的时候,启动这个新进程的那个进程被称为父进程。新的进程是父进程的一个子进程。它们是树状结构的关系。
如果你在htop里按F5键,就可以看到分层的进程。
你也可以使用ps的f选项:
$ ps f
PID TTY      STAT   TIME COMMAND
12472 pts/0    Ss     0:00 -bash
12684 pts/0    R+     0:00  \_ ps f
或者pstree:
$ pstree -a
init
├─atd
├─cron
├─sshd -D
│   └─sshd
│       └─sshd
│           └─bash
│               └─pstree -a
...
这也就是为什么你可能经常看到bash或者sshd 是一些进程的父进程的原因。
当你在bash里运行date,会发生以下这些事:
bash新建一个进程,这个进程是它自身的拷贝(使用fork系统调用)- 接着从可执行文件
/bin/date加载程序到内存中(使用exec系统调用) bash作为父进程将等待直到它的子进程退出
ID 为1 的/sbin/init是在启动时运行的,它生成了SSH 守护进程sshd。当你连接到计算机时,sshd将产生一个会话进程,这个会话进程再启动bash。
我喜欢在htop中使用树状图,当我想看到所有线程的时候。
进程用户
每个进程都属于一个用户,通过一个数字标识用户。
$ sleep 1000 &
[1] 2045
$  grep Uid /proc/2045/status
Uid:    1000    1000    1000    1000
你可以用id命令找出这个UID 的用户名。
$ id 1000
uid=1000(ubuntu) gid=1000(ubuntu) groups=1000(ubuntu),4(adm)
实际上id 是从/etc/passwd和/etc/group文件中获取信息。
$ strace -e open id 1000
...
open("/etc/nsswitch.conf", O_RDONLY|O_CLOEXEC) = 3
open("/lib/x86_64-linux-gnu/libnss_compat.so.2", O_RDONLY|O_CLOEXEC) = 3
open("/lib/x86_64-linux-gnu/libnss_files.so.2", O_RDONLY|O_CLOEXEC) = 3
open("/etc/passwd", O_RDONLY|O_CLOEXEC) = 3
open("/etc/group", O_RDONLY|O_CLOEXEC)  = 3
...
这是因为Name Service Switch (NSS)的配置文件/etc/nsswitch.conf表示通过这些文件解析名称。
$ head -n 9 /etc/nsswitch.conf
# ...
passwd:         compat
group:          compat
shadow:         compat
compat(兼容模式:Compatibility mode)这个配置项和files作用一样,除了支持一些特殊的条目。files表示数据存在一个文件中(通过libnss_files.so加载)。不过你也可以把你的用户信息存在其他数据库或者服务中,例如使用轻型目录访问协议(LDAP)等。
/etc/passwd和/etc/group是纯文本文件,将数字化的用户ID 映射到对人类可读的名称。
$ cat /etc/passwd
root:x:0:0:root:/root:/bin/bash
daemon:x:1:1:daemon:/usr/sbin:/usr/sbin/nologin
ubuntu:x:1000:1000:Ubuntu:/home/ubuntu:/bin/bash
$ cat /etc/group
root:x:0:
adm:x:4:syslog,ubuntu
ubuntu:x:1000:
passwd?哪里有密码?
它们实际上是在/etc/shadow中。
$ sudo cat /etc/shadow
root:$6$mS9o0QBw$P1ojPSTexV2PQ.Z./rqzYex.k7TJE2nVeIVL0dql/:17126:0:99999:7:::
daemon:*:17109:0:99999:7:::
ubuntu:$6$GIfdqlb/$ms9ZoxfrUq455K6UbmHyOfz7DVf7TWaveyHcp.:17126:0:99999:7:::
这些乱七八糟的内容是什么?
$6$是使用的密码hash 算法,现在这个表示的是sha512- 紧跟着的是随机产生的盐,防止彩虹表攻击
- 最后是密码+盐的hash 值
当你运行一个程序的时候,它会以你的用户运行。即时这个可执行文件不属于你。
如果你想以root或者其他用户运行程序,可以使用sudo。
$ id
uid=1000(ubuntu) gid=1000(ubuntu) groups=1000(ubuntu),4(adm)
$ sudo id
uid=0(root) gid=0(root) groups=0(root)
$ sudo -u ubuntu id
uid=1000(ubuntu) gid=1000(ubuntu) groups=1000(ubuntu),4(adm)
$ sudo -u daemon id
uid=1(daemon) gid=1(daemon) groups=1(daemon)
如果你想要登录其他用户的帐号来运行更多的命令该怎么做?可以使用sudo bash或sudo -u user bash。你将能以其他用户的身份使用shell。
如果你不喜欢每次都被要求输入root 密码,把你的用户名添加到/etcsudoers文件中就能关闭它。
让我们试一试:
$ echo "$USER ALL=(ALL) NOPASSWD: ALL" >> /etc/sudoers
-bash: /etc/sudoers: Permission denied
好吧,只有root 才有权限。
$ sudo echo "$USER ALL=(ALL) NOPASSWD: ALL" >> /etc/sudoers
-bash: /etc/sudoers: Permission denied
我擦,什么情况?
现在你是以root 用户执行了echo命令,不过追加内容到/etc/sudoers还是以你的用户身份。
通常有两种方法解决这个问题:
echo "$USER ALL=(ALL) NOPASSWD: ALL" | sudo tee -a /etc/sudoerssudo bash -c "echo '$USER ALL=(ALL) NOPASSWD: ALL' >> /etc/sudoers"
第一个例子中,tee -a将标准输出的内容追加到文件中,我们是以root 用户执行这个命令的。
第二个例子中,我们以root 用户运行bash,并让它执行一条命令,这条命令会以root 用户执行。
注意这里面复杂的单引号和双引号,它们决定了$USER标量什么时候被展开。
如果你看一眼/etc/sudoers文件,在开头你会看到:
$ sudo head -n 3 /etc/sudoers
#
# This file MUST be edited with the 'visudo' command as root.
#
哎呦。
这是一个有用的警告,说你应该使用sudo visudo来编辑这个文件。它会在你保存文件之前校验内容,防止发生错误。
如果你没有使用visudo而导致错误的话,将把你锁定无法使用sudo。这意味着你没法修正错误。
假设你想要修改你的密码,你可以使用password命令。如前面提到的,它会把密码保存在/etc/shaow文件中。
这个文件非常敏感,只有root 用户才能写:
$ ls -l /etc/shadow
-rw-r----- 1 root shadow 1122 Nov 27 18:52 /etc/shadow
所以普通用户执行的password程序是怎么可能写入内容到一个守保护的文件呢?
我前面说过当你执行一个程序的时候,它是以你的身份执行的,即使这个可执行文件的所有者是另外一个用户。
实际上你可以通过修改文件权限改变这个行为。让我们看看。
$ ls -l /usr/bin/passwd
-rwsr-xr-x 1 root root 54256 Mar 29  2016 /usr/bin/passwd
注意s的字母。这是通过sudo chmod u+s /usr/bin/passwd加上的。它表示一个可执行文件会以文件的所有者的身份被执行,这里是以root 用户执行。
你可以用find /bin -user root -perm -u+s 找到具有setuid权限的可执行文件。
注意你也可以对用户组执行相同的操作(g+s)。
进程状态
接下来我们看一下htop中用字母s表示的进程状态这一列。
几种可能的值:
R    running or runnable (on run queue) 运行中或者即将运行
S    interruptible sleep (waiting for an event to complete) 中断睡眠
D    uninterruptible sleep (usually IO) 不可中断睡眠
Z    defunct ("zombie") process, terminated but not reaped by its parent 僵尸进程
T    stopped by job control signal 被制信号停止
t    stopped by debugger during the tracing 被debugger 停止
X    dead (should never be seen) 死亡
我把它们按照出现的频率如上排序。
注意当你执行ps的时候,也会出现例如Ss,R+,Ss+等状态。
$ ps x
PID TTY      STAT   TIME COMMAND
1688 ?        Ss     0:00 /lib/systemd/systemd --user
1689 ?        S      0:00 (sd-pam)
1724 ?        S      0:01 sshd: vagrant@pts/0
1725 pts/0    Ss     0:00 -bash
2628 pts/0    R+     0:00 ps x
R - running or runnable (on run queue)
这种状态下的进程,要么是正在运行中,要么就是在等待运行的队列中。
什么是运行?
当你从源代码编译你的程序后,得到的机器代码其实是CPU 指令。它们被保存到文件中等待执行。当你加载程序的时候,它们被加载到内存中,接着CPU 会执行这些指令。
基本上这个状态意味着CPU 在执行指令,或者说在处理数学运算。
S - interruptible sleep (waiting for an event to complete)
这个状态表示该进程的代码指令此刻没在CPU 上运行。相反,进程正在等待一个事件或者一条触发条件产生。当事件发生时,内核会将状态设置为运行中。
一个例子是核心工具包里的sleep(译注:GNU核心工具组(英语:GNU Core Utilities,亦常缩写为Coreutils),参考 GNU核心工具组)。它能睡眠指定的秒数(大致上)。
$ sleep 1000 &
[1] 10089
$ ps f
PID TTY      STAT   TIME COMMAND
3514 pts/1    Ss     0:00 -bash
10089 pts/1    S      0:00  \_ sleep 1000
10094 pts/1    R+     0:00  \_ ps f
这是可中断的睡眠。那我们怎么中断它?
通过发送信号。
在htop里你可以按下F9然后在菜单左则选择一个信号来发送。
发送信号也被称为kill。这是因为kill是一个系统调用,它可以给一个进程发送信号。/bin/kill 程序可以从用户空间发起系统调用,默认的信号是TERM,这个信号会让进程退出,或者说会杀死进程。
信号只是一个数字。不过数字很难记,所以我们给它们取了名字。信号名称常常大写,并以SIG为开头。
一些常用的信号是INT,KILL,STOP,CONT,HUP。
让我们给sleep 进程发送INT(也可称为SIGINT,2,Terminal interrupt)信号中断睡眠。
$ kill -INT 10089
[1]+  Interrupt               sleep 1000
当你按下CTRL键和C键的时候,也会发生以上现象。bash会像我们刚刚那样,给所有后台程序发送SIGINT信号。
顺便说一下,kill是bash内置的命令,虽然在大多数系统上有/bin/kill。为什么呢?这是为了当你创建的进程数量达到限制时,还可以用它来杀死进程。
下列命令是做同样一件事:
kill -INT 10089kill -2 10089/bin/kill -2 10089
另外一个有用的信号是SIGKILL,又称为9。当你狂按CTRL和C键不起的作用时,你可能曾用过它来杀死过进程。
当你写一个程序时,你可以写一些信号处理函数,当你的程序收到信号的时就会调用这些函数。换句话说,你可以捕获信号来做一些事情。举个例子,做一些清理工作和优雅的关闭程序。
所以发送SIGINT(用户想要中断一个进程)和SIGTERM(用户想要终止一个进程)并不意味着进程能够被终止。
你可以见过这个异常,当运行Python 脚本的时候:
$ python -c 'import sys; sys.stdin.read()'
^C
Traceback (most recent call last):
File "<string>", line 1, in <module>
KeyboardInterrupt
你可以通过发送KILL型号让内核强制终止一个进程,不让它有机会响应(译注:原文是 not give it a change to respond ,怀疑是不是作者打错了chance)。
$ sleep 1000 &
[1] 2658
$ kill -9 2658
[1]+  Killed                  sleep 1000
D - uninterruptible sleep (usually IO)
不同于可中断睡眠,你无法用信号唤醒这个状态下的进程。这也就是为什么很多人怕看到这个状态的原因。你不能杀死这样的进程,以为杀死意味着给进程发送SIGKILL 信号。
如果进程必须等待并不能被中断,或者有事件会马上发生,就会用这个状态。比如从磁盘读取内容。但是这只能发生几秒钟。
StackOverflow 上一个不错的解答:
Uninterruptable processes are USUALLY waiting for I/O following a page fault. The process/task cannot be interrupted in this state, because it can't handle any signals; if it did, another page fault would happen and it would be back where it was.
换句话说,如果你使用网络文件系统(NFS),这种清空就会发生,从NSF 读写文件需要花一段时间。
根据我的经验,这也意味着你的一些进程多次读写交换分区,空闲的内存空间不够用了。
我们试一试让一个进程进入不可中断状态。
8.8.8.8是一个Google 提供的公用DNS 服务器。它们没有提供一个开发的NFS。不过这不能阻止我们。
$ sudo mount 8.8.8.8:/tmp /tmp &
[1] 12646
$ sudo ps x | grep mount.nfs
12648 pts/1    D      0:00 /sbin/mount.nfs 8.8.8.8:/tmp /tmp -o rw
如何找出进入这个状态原因?strace!
让我们用strace跟踪ps 上面的命令:
$ sudo strace /sbin/mount.nfs 8.8.8.8:/tmp /tmp -o rw
...
mount("8.8.8.8:/tmp", "/tmp", "nfs", 0, ...
是mount这个系统调用阻塞了进程。
如果你想知道的话,你可以运行mount 时加上intr选项,让它运行在中断模式下:sudo mount 8.8.8.8:/tmp /tmp -o intr。
Z - defunct ("zombie") process, terminated but not reaped by its parent
当进程通过exit 退出后,子进程还存在的话,它的子进程会变成僵尸进程。
- 如果僵尸进程短时间存在,这很正常。
- 僵尸进程长时间存在的话,辨明程序有一个bug
- 僵尸进程不会消耗进程,它只是一个进程ID
- 你不能
kill一个僵尸进程 - 你可以请求父进程回收僵尸进程(
SIGHLD信号) - 你可以
kill僵尸进程的父进程,以此去除父进程和它的僵尸进程
我将写一段C 代码来演示这个。
这是我的程序。
#include <stdio.h>
#include <stdlib.h>
#include <unistd.h>

int main() {
    printf("Running\n");

    int pid = fork();

    if (pid == 0) {
        printf("I am the child process\n");
        printf("The child process is exiting now\n");
        exit(0);
    } else {
        printf("I am the parent process\n");
        printf("The parent process is sleeping now\n");
        sleep(20);
        printf("The parent process is finished\n");
    }

    return 0;
}
我们来安装GNU C 编译器(GCC)。
sudo apt install -y gcc
编译并运行。
gcc zombie.c -o zombie
./zombie
看下进程树。
$ ps f
PID TTY      STAT   TIME COMMAND
3514 pts/1    Ss     0:00 -bash
7911 pts/1    S+     0:00  \_ ./zombie
7912 pts/1    Z+     0:00      \_ [zombie] <defunct>
1317 pts/0    Ss     0:00 -bash
 7913 pts/0    R+     0:00  \_ ps f
我们得到了僵尸进程。
当父进程退出之后,僵尸进程也退出了。
$ ps f
PID TTY      STAT   TIME COMMAND
3514 pts/1    Ss+    0:00 -bash
1317 pts/0    Ss     0:00 -bash
 7914 pts/0    R+     0:00  \_ ps f
如果你用sleep 20代替while (true) ;,僵尸进程会马上退出。
通过exit退出,所有申请的内存和资源会马上释放,以供其他进程使用。
父进程可以使用wait系统调用找到子进程的退出代码(在信号处理函数中)。如果一个进程正在睡眠状态,需要等待它醒来。
为什么不简单粗暴的唤醒进程,然后杀死它?同样的原因,你也不会在厌烦你孩子的时候把它丢进垃圾桶。后果很严重。
T - stopped by job control signal
我打开了两个终端窗口,用ps u可以看到我的用户进程。
$ ps u
USER       PID %CPU %MEM    VSZ   RSS TTY      STAT START   TIME COMMAND
ubuntu    1317  0.0  0.9  21420  4992 pts/0    Ss+  Jun07   0:00 -bash
ubuntu    3514  1.5  1.0  21420  5196 pts/1    Ss   07:28   0:00 -bash
ubuntu    3528  0.0  0.6  36084  3316 pts/1    R+   07:28   0:00 ps u
下文的输出中我会忽略-bash和ps u进程。
现在在一个终端中运行cat /dev/urandom > /dev/null。它的状态是R+,意味着它在运行中。
$ ps u
USER       PID %CPU %MEM    VSZ   RSS TTY      STAT START   TIME COMMAND
ubuntu    3540  103  0.1   6168   688 pts/1    R+   07:29   0:04 cat /dev/urandom
按下CTRL加Z键,终止进程。
$ # CTRL+Z
[1]+  Stopped                 cat /dev/urandom > /dev/null
$ ps aux
USER       PID %CPU %MEM    VSZ   RSS TTY      STAT START   TIME COMMAND
ubuntu    3540 86.8  0.1   6168   688 pts/1    T    07:29   0:15 cat /dev/urandom
现在它的状态是T。
在第一个终端运行fg,恢复它。
另外一个终止进程的方法是通过kill发送STOP信号。你可以用CONT型号,让进程恢复执行。
t - stopped by debugger during the tracing
首选,安装GNU Debugger(gdb)
sudo apt install -y gdb
运行一个进程,它会在1234 端口上监听进入的网络连接。
$ nc -l 1234 &
[1] 3905
它在睡眠中意味着它正在等待网络数据。
$ ps u
USER       PID %CPU %MEM    VSZ   RSS TTY      STAT START   TIME COMMAND
ubuntu    3905  0.0  0.1   9184   896 pts/0    S    07:41   0:00 nc -l 1234
运行debugger,连接上ID是3905 的进程。
sudo gdb -p 3905
你会看到进程状态变为t,意味着这个进程正在被debugger 跟踪。
进程时间片
Linux 是一个多任务的操作系统,这意味着即使你只有一颗CPU,也可以同时跑多个进程。当你的Web server 通过互联网把你的博客内容分发给读者的时候,你可以通过SSH 连接到你的服务器,看一下htop的输出内容。
一颗CPU同一时刻只能运行一条指令,那这是怎么做到的?
答案是分时。
一个进程运行一点时间,接着它进入睡眠,因为其他进程在等待轮流运行。进程运行的一小段时间被称谓时间片。
一个时间片通常是几毫秒,所以在系统负载不高的时候,你不会注意到它。(找出Linux 的时间片是多长很有意思。)
这应该可以解释为什么平均负载是运行中的平均进程数。如果你只有一个核心,并且平均负载是1.0,则CPU 利用率是100%。如果平均负载大于1.0,这意味着等待运行的进程超过CPU 可以运行的数量,所以这时你可能会感觉到卡顿。如果平均负载低于1.0,意味着CPU 有时空闲着不做事。
这应该让你有了思路,为什么有时运行一个执行时间为10秒的进程,运行时间可能长于或者短于10秒。
进程友好度和优先级
当你有超过CPU H核心数的进程需要运行的时候,你得想个方式决定下一步运行哪些进程,以及让哪些进程排队等待。这就是任务调度器的工作。
Linux 内核的调度器负责从运行队列中选出下一个运行的进程,具体的选取方法取决于内核使用的调度算法。
通常你没法影响调度器,不过你可以让调度器知道哪些程序对你来说更重要,调度器会特别关注一下。
友好度(NI)是进程的用户空间优先级,范围从-20(优先级最高)到19(优先级最低)。这可能让人有点费解,不过你可以这样想,一个友好的进程会谦让一个不友好的进程。所以一个进程越友好,它谦让得越多。
通过阅读StackOverflow 和其他站点,我总结整理了下,一个进程的Nice 值每提高1,会让出超过10% 的CPU 时间。
优先级(PRI)是Linux 内核使用的内核空间的优先级。优先级的范围是0到139,其中0到99 用于实时进程,100到139 用于用户进程。
你可以改变进程的友好度,内核会考虑到,不过你没法改变优先级。
nice 值和优先级的关系是:
PR = 20 + NI
所以PR=20 + (-20 to +19) 的值是0 到39,对应的优先级是100到139 。
你可以在启动一个进程前设置它的友好度。
nice -n niceness program
可以用renice改变运行中的进程的友好度。
renice -n niceness -p PID
以下是不同颜色的CPU 利用率的含义:
- 蓝色:低优先级的线程(nice > 0)
- 绿色:普通优先级的线程
- 红色:内核线程
http://askubuntu.com/questions/656771/process-niceness-vs-priority
内存使用情况 - VIRT/RES/SHR/MEM
一个进程会有它是内存里面唯一一个的错觉。这是通过虚拟内存实现的。
进程没有直接访问物理内存的权限。取而代之的是,它有自己的虚拟地址空间,内核会把虚拟地址空间转换到物理内存地址,或者映射到磁盘上。这就是为什么看起来进程使用的内存超过你计算机上实际的内存。
在这里我想提出的是弄清楚一个进程到底使用了多少内存不太容易。你也想统计贡献库和磁盘映射的内存?内核提供的和htop 展示的一些信息可以帮你估算内存使用情况。
不同颜色的内存使用量的含义:
- 绿色:已使用的内存
- 蓝色:Buffer
- 橘黄色:Cache
VIRT/VSZ - 虚拟镜像
The total amount of virtual memory used by the task. It includes all code, data and shared libraries plus pages that have been swapped out and pages that have been mapped but not used.
VIRT是虚拟内存使用量。它包括所有东西,包括映射的文件。
如果一个应用程序申请了1GB 内存,但是实际只用了1MB,VIRT也会显示 1GB。如果它mmap一个1GB 的文件,但不使用,VIRT也会显示为 1GB。
大多数时候,这个值没啥用。
RES/RSS - 常驻大小
The non-swapped physical memory a task has used.
RES是常驻内存的使用量,即当前物理内存使用量。
虽然RES相比VIRT可以更好的表示进程的内存使用量,不过请记住
- 它不包括交换出的内存(译注:即在swap 上的内容)
- 可能包括和其他进程的共享内存
如果一个进程使用了1GB 内存,它调用fork(),fork 的结果是有2 个进程,它们的RES都是1GB,不过实际上只用了1GB,因为Linux 的写入时复制(译注:写入时复制)。
SHR - 共享内存大小
The amount of shared memory used by a task. It simply reflects memory that could be potentially shared with other processes.
#include <stdio.h>
#include <stdlib.h>
#include <unistd.h>

int main() {
    printf("Started\n");
    sleep(10);

    size_t memory = 10 * 1024 * 1024; // 10 MB
    char* buffer = malloc(memory);
    printf("Allocated 10M\n");
    sleep(10);

    for (size_t i = 0; i < memory/2; i++)
        buffer[i] = 42;
    printf("Used 5M\n");
    sleep(10);

    int pid = fork();
    printf("Forked\n");
    sleep(10);

    if (pid != 0) {
        for (size_t i = memory/2; i < memory/2 + memory/5; i++)
            buffer[i] = 42;
            printf("Child used extra 2M\n");
    }
    sleep(10);

    return 0;
}
fallocate -l 10G
gcc -std=c99 mem.c -o mem
./mem
Process  Message               VIRT  RES SHR
main     Started               4200  680 604
main     Allocated 10M        14444  680 604
main     Used 5M              14444 6168 1116
main     Forked               14444 6168 1116
child    Forked               14444 5216 0
main     Child used extra 2M        8252 1116
child    Child used extra 2M        5216 0
TODO: I should finish this.
MEM% - 内存使用率
A task's currently used share of available physical memory.
RES 除以 总物理内存大小。
如果RES是500M,你有8G内存,MEM% 将是400/8192*100 = 4.88%。
进程
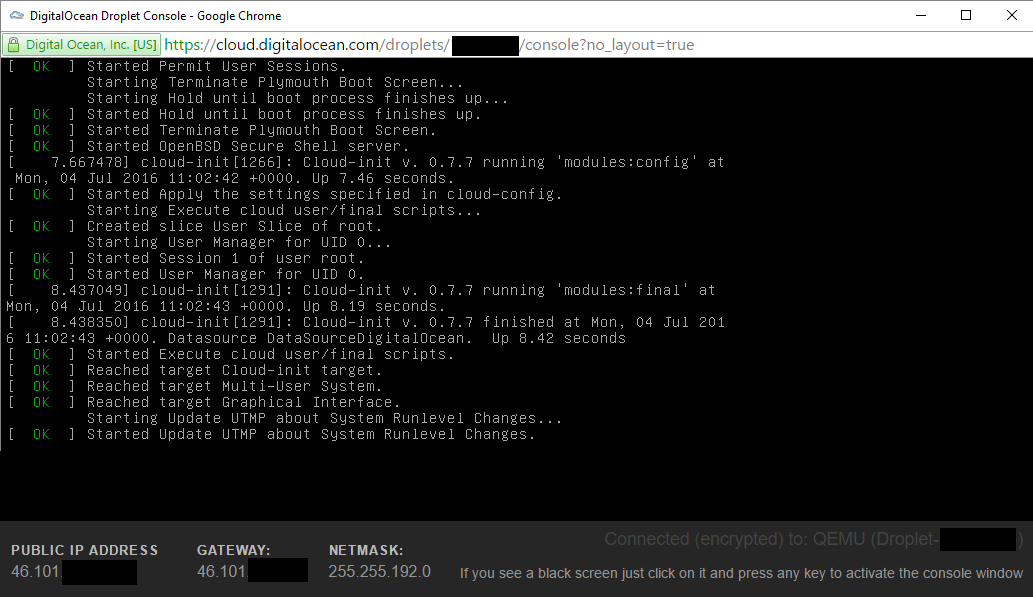
我在Digital Ocean 上启动了一台Ubuntu Server。
系统启动的时候会运行哪些进程呢?
你真的需要它们吗?
我在Digital Ocean 新启动了一台Ubuntu Server 16.04.1 LTS x64 ,这是关于它的开机启动程序的调研笔记。
开始之前

/sbin/init
The /sbin/init program (also called init) coordinates the rest of the boot process and configures the environment for the user.
When the init command starts, it becomes the parent or grandparent of all of the processes that start up automatically on the system.
是Systemd 吗?
$ dpkg -S /sbin/init
systemd-sysv: /sbin/init
是的,就是它。
如果你kill 掉它会发生什么?
什么都不会发生(译注:How does systemd survive a kill -9?)。
- https://wiki.ubuntu.com/SystemdForUpstartUsers
- https://www.centos.org/docs/5/html/5.1/Installation_Guide/s2-boot-init-shutdown-init.html
/lib/systemd/systemd-journald
systemd-journald is a system service that collects and stores logging data. It creates and maintains structured, indexed journals based on logging information that is received from a variety of sources.
换种说法:
One of the main changes in journald was to replace simple plain text log files with a special file format optimized for log messages. This file format allows system administrators to access relevant messages more efficiently. It also brings some of the power of database-driven centralized logging implementations to individual systems.
你应该用journalctl命令来查询日志。
journalctl _COMM=sshdsshd 日志journalctl _COMM=sshd -o json-prettyJSON 格式的sshd 日志journalctl --since "2015-01-10" --until "2015-01-11 03:00"journalctl --since 09:00 --until "1 hour ago"journalctl --since yesterdayjournalctl -b启动以来的日志journalctl -f滚动更新日志journalctl --disk-usagejournalctl --vacuum-size=1G
太酷了。
看起来没法禁用或者移除这个服务,你只能关闭日志记录。
- https://www.freedesktop.org/software/systemd/man/systemd-journald.service.html
- https://www.digitalocean.com/community/tutorials/how-to-use-journalctl-to-view-and-manipulate-systemd-logs
- https://www.loggly.com/blog/why-journald/
- https://ask.fedoraproject.org/en/question/63985/how-to-correctly-disable-journald/
/sbin/lvmetad -f
The lvmetad daemon caches LVM metadata, so that LVM commands can read metadata without scanning disks.
Metadata caching can be an advantage because scanning disks is time consuming and may interfere with the normal work of the system and disks.
什么是LVM(逻辑分卷管理器)?
You can think of LVM as "dynamic partitions", meaning that you can create/resize/delete LVM "partitions" (they're called "Logical Volumes" in LVM-speak) from the command line while your Linux system is running: no need to reboot the system to make the kernel aware of the newly-created or resized partitions.
听起来如果你在用LVM 的话,应该保留这个服务。
$ lvscan
$ sudo apt remove lvm2 -y --purge
- http://manpages.ubuntu.com/manpages/xenial/man8/lvmetad.8.html
- http://askubuntu.com/questions/3596/what-is-lvm-and-what-is-it-used-for
/lib/systemd/udevd
systemd-udevd listens to kernel uevents. For every event, systemd-udevd executes matching instructions specified in udev rules.
udev is a device manager for the Linux kernel. As the successor of devfsd and hotplug, udev primarily manages device nodes in the /dev directory.
所以这个服务是管理dev的。
我不确定在虚拟机上是否需要它。
- https://www.freedesktop.org/software/systemd/man/systemd-udevd.service.html
- https://wiki.archlinux.org/index.php/udev
/lib/systemd/timesyncd
systemd-timesyncd is a system service that may be used to synchronize the local system clock with a remote Network Time Protocol server.
所以这是用来代替ntpd的。
$ timedatectl status
Local time: Fri 2016-08-26 11:38:21 UTC
Universal time: Fri 2016-08-26 11:38:21 UTC
RTC time: Fri 2016-08-26 11:38:20
Time zone: Etc/UTC (UTC, +0000)
Network time on: yes
NTP synchronized: yes
 RTC in local TZ: no
如果我们看一下服务器上打开的端口:
$ sudo netstat -nlput
Active Internet connections (only servers)
Proto Recv-Q Send-Q Local Address           Foreign Address         State       PID/Program name
tcp        0      0 0.0.0.0:22              0.0.0.0:*               LISTEN      2178/sshd
tcp6       0      0 :::22                   :::*                    LISTEN      2178/sshd
赞!
之前的Ubuntu 14.04 是这样的:
$ sudo apt-get install ntp -y
$ sudo netstat -nlput
Active Internet connections (only servers)
Proto Recv-Q Send-Q Local Address           Foreign Address         State       PID/Program name
tcp        0      0 0.0.0.0:22              0.0.0.0:*               LISTEN      1380/sshd
tcp6       0      0 :::22                   :::*                    LISTEN      1380/sshd
udp        0      0 10.19.0.6:123           0.0.0.0:*                           2377/ntpd
udp        0      0 139.59.256.256:123      0.0.0.0:*                           2377/ntpd
udp        0      0 127.0.0.1:123           0.0.0.0:*                           2377/ntpd
udp        0      0 0.0.0.0:123             0.0.0.0:*                           2377/ntpd
udp6       0      0 fe80::601:6aff:fxxx:123 :::*                                2377/ntpd
udp6       0      0 ::1:123                 :::*                                2377/ntpd
udp6       0      0 :::123                  :::*                                2377/ntpd
额。
- https://www.freedesktop.org/software/systemd/man/systemd-timesyncd.service.html
- https://wiki.archlinux.org/index.php/systemd-timesyncd
/usr/sbin/atd -f
atd - run jobs queued for later execution. atd runs jobs queued by at.
at and batch read commands from standard input or a specified file which are to be executed at a later time
不同于周期性重复执行任务的cron,at 只会在指定时刻执行一次任务。
$ echo "touch /tmp/yolo.txt" | at now + 1 minute
job 1 at Fri Aug 26 10:44:00 2016
$ atq
1       Fri Aug 26 10:44:00 2016 a root
$ sleep 60 && ls /tmp/yolo.txt
/tmp/yolo.txt
实际上迄今为止我都没用过它。
sudo apt remove at -y --purge
- http://manpages.ubuntu.com/manpages/xenial/man8/atd.8.html
- http://manpages.ubuntu.com/manpages/xenial/man1/at.1.html
- http://askubuntu.com/questions/162439/why-does-ubuntu-server-run-both-cron-and-atd
/usr/lib/snapd/snapd
Snappy Ubuntu Core is a new rendition of Ubuntu with transactional updates - a minimal server image with the same libraries as today’s Ubuntu, but applications are provided through a simpler mechanism.
什么?
Developers from multiple Linux distributions and companies today announced collaboration on the “snap” universal Linux package format, enabling a single binary package to work perfectly and securely on any Linux desktop, server, cloud or device.
显而易见这是一个简化的deb 包,你可以将所有依赖打进一个Snappy 来分发。
我从来没在服务器上用Snappy 部署或分发过应用程序。
sudo apt remove snapd -y --purge
- https://developer.ubuntu.com/en/snappy/
- https://insights.ubuntu.com/2016/06/14/universal-snap-packages-launch-on-multiple-linux-distros/
/usr/bin/dbus-daemon
In computing, D-Bus or DBus is an inter-process communication (IPC) and remote procedure call (RPC) mechanism that allows communication between multiple computer programs (that is, processes) concurrently running on the same machine
我的理解是桌面环境或者在服务器上运行web 应用才需要这个?
sudo apt remove dbus -y --purge
我想知道现在是什么时候,是否和NTP 保持同步。
$ timedatectl status
Failed to create bus connection: No such file or directory
糟糕。应该保留这个的。
/lib/systemd/systemd-logind
systemd-logind is a system service that manages user logins.
/usr/sbin/cron -f
cron - daemon to execute scheduled commands (Vixie Cron)
-fStay in foreground mode, don't daemonize.
你可以安排cron 周期性的重复执行任务。
用crontab -e来编辑你的配置,不过我更倾向于使用/etc/cron.hourly,/etc/cron.daily等目录。
你可以用以下方法查看日志文件
grep cron /var/log/syslog或者journalctl _COMM=cron甚至journalctl _COMM=cron --since="date" --until="date"
你可能想保留cron。
如果不想的话,应该停止和禁用这个服务。
sudo systemctl stop cron
sudo systemctl disable cron
因为如果我们尝试通过apt remove cron卸载它的话,系统会安装postfix!
$ sudo apt remove cron
The following packages will be REMOVED:
cron
The following NEW packages will be installed:
  anacron bcron bcron-run fgetty libbg1 libbg1-doc postfix runit ssl-cert ucspi-unix
看起来cron 需要通过一个邮件传输代理(MTA)来发送邮件。
$ apt show cron
Package: cron
Version: 3.0pl1-128ubuntu2
...
Suggests: anacron (>= 2.0-1), logrotate, checksecurity, exim4 | postfix | mail-transport-agent

$ apt depends cron
cron
...
Suggests: anacron (>= 2.0-1)
Suggests: logrotate
Suggests: checksecurity
|Suggests: exim4
|Suggests: postfix
Suggests: <mail-transport-agent>
...
exim4-daemon-heavy
    postfix
- https://help.ubuntu.com/community/CronHowto
- https://www.digitalocean.com/community/tutorials/how-to-use-cron-to-automate-tasks-on-a-vps
- http://unix.stackexchange.com/questions/212355/where-is-my-logfile-of-crontab
/usr/sbin/rsyslogd -n
Rsyslogd is a system utility providing support for message logging.
换句话说,它产生/var/log下的日志文件,例如记录了SSH登录的认证消息的/var/log/auth.log。
配置文件在/etc/rsyslog.d目录下。
你也可以配置rsyslogd 发送日志到远程服务器,实现集中记录日志。
你可以在后台脚本里(例如开机启动的脚本)使用logger命令,把消息记录到/var/log/syslog。
#!/bin/bash

logger Starting doing something
# NFS, get IPs, etc.
logger Done doing something
对了,我们已经运行着systemd-journald,还需要rsyslogd吗?
Rsyslog and Journal, the two logging applications present on your system, have several distinctive features that make them suitable for specific use cases. In many situations it is useful to combine their capabilities, for example to create structured messages and store them in a file database. A communication interface needed for this cooperation is provided by input and output modules on the side of Rsyslog and by the Journal's communication socke
所以,可能需要吧?以防万一我决定留着它。
- http://manpages.ubuntu.com/manpages/xenial/man8/rsyslogd.8.html
- http://manpages.ubuntu.com/manpages/xenial/man1/logger.1.html
- https://wiki.archlinux.org/index.php/rsyslog
- https://www.digitalocean.com/community/tutorials/how-to-centralize-logs-with-rsyslog-logstash-and-elasticsearch-on-ubuntu-14-04
- https://access.redhat.com/documentation/en-US/Red_Hat_Enterprise_Linux/7/html/System_Administrators_Guide/s1-interaction_of_rsyslog_and_journal.html
/usr/sbin/acpid
acpid - Advanced Configuration and Power Interface event daemon
acpid is designed to notify user-space programs of ACPI events. acpid should be started during the system boot, and will run as a background process, by default.
In computing, the Advanced Configuration and Power Interface (ACPI) specification provides an open standard that operating systems can use to perform discovery and configuration of computer hardware components, to perform power management by, for example, putting unused components to sleep, and to do status monitoring.
但是我是在虚拟机里,我不打算休眠/恢复。
我要移除它看看会发生什么。
sudo apt remove acpid -y --purge
我能够成功reboot,但是halt 之后Digital Ocean任务它还在运行,所以不得不在web 界面上关闭电源。
所以我应该留着它。
- http://manpages.ubuntu.com/manpages/xenial/man8/acpid.8.html
- https://en.wikipedia.org/wiki/Advanced_Configuration_and_Power_Interface
/usr/bin/lxcfs /var/lib/lxcfs/
Lxcfs is a fuse filesystem mainly designed for use by lxc containers. On a Ubuntu 15.04 system, it will be used by default to provide two things: first, a virtualized view of some /proc files; and secondly, filtered access to the host’s cgroup filesystems.
In summary, on a 15.04 host, you can now create a container the usual way, lxc-create ... The resulting container will have “correct” results for uptime, top, etc.
It’s basically a userspace workaround to changes which were deemed unreasonable to do in the kernel. It makes containers feel much more like separate systems than they would without it.
不用LXC 容器?你可以移除它。
sudo apt remove lxcfs -y --purge
- https://insights.ubuntu.com/2015/03/02/introducing-lxcfs/
- https://www.stgraber.org/2016/03/31/lxcfs-2-0-has-been-released/
/usr/lib/accountservice/accounts-daemon
The AccountsService package provides a set of D-Bus interfaces for querying and manipulating user account information and an implementation of these interfaces based on the usermod(8), useradd(8) and userdel(8) commands.
我移除DBus 的时候损坏了timedatectl,不知道我移除了这个服务之后会损坏什么。
sudo apt remove accountsservice -y --purge
时间会说明一切。
/sbin/mdadm
mdadm is a Linux utility used to manage and monitor software RAID devices.
The name is derived from the md (multiple device) device nodes it administers or manages, and it replaced a previous utility mdctl. The original name was "Mirror Disk", but was changed as the functionality increased.
RAID is a method of using multiple hard drives to act as one. There are two purposes of RAID: 1) Expand drive capacity: RAID 0. If you have 2 x 500 GB HDD then total space become 1 TB. 2) Prevent data loss in case of drive failure: For example RAID 1, RAID 5, RAID 6, and RAID 10.
你可以移除它。
sudo apt remove mdadm -y --purge
- https://en.wikipedia.org/wiki/Mdadm
- https://help.ubuntu.com/community/Installation/SoftwareRAID
- http://manpages.ubuntu.com/manpages/xenial/man8/mdadm.8.html
/usr/lib/policykit-1/polkitd --no-debug
polkitd — PolicyKit daemon
polkit - Authorization Framework
我的理解是这像是一个精细的sudo 。你可以允许非特权用户以root 的身份做某些操作。例如重启你的桌面版Linux。
不过我运行的是一台服务器。你可以移除它。
sudo apt remove policykit-1 -y --purge
还在考虑这样是不是破坏了某些东西。
- http://manpages.ubuntu.com/manpages/xenial/man8/polkitd.8.html
- http://manpages.ubuntu.com/manpages/xenial/man8/polkit.8.html
- http://www.admin-magazine.com/Articles/Assigning-Privileges-with-sudo-and-PolicyKit
- https://wiki.archlinux.org/index.php/Polkit#Configuration
/usr/sbin/sshd -D
sshd (OpenSSH Daemon) is the daemon program for ssh.
-D When this option is specified, sshd will not detach and does not become a daemon. This allows easy monitoring of sshd.
/sbin/iscsid
iscsid 是一个运行在后台的daemon(系统服务)进程,用于配置iSCSI 和管理连接。摘自它的主页:
The iscsid implements the control path of iSCSI protocol, plus some management facilities. For example, the daemon could be configured to automatically re-start discovery at startup, based on the contents of persistent iSCSI database.
http://unix.stackexchange.com/questions/216239/iscsi-vs-iscsid-services
我从来没听说过iSCSI:
In computing, iSCSI (Listeni/aɪˈskʌzi/ eye-skuz-ee) is an acronym for Internet Small Computer Systems Interface, an Internet Protocol (IP)-based storage networking standard for linking data storage facilities.
By carrying SCSI commands over IP networks, iSCSI is used to facilitate data transfers over intranets and to manage storage over long distances. iSCSI can be used to transmit data over local area networks (LANs), wide area networks (WANs), or the Internet and can enable location-independent data storage and retrieval.
The protocol allows clients (called initiators) to send SCSI commands (CDBs) to SCSI storage devices (targets) on remote servers. It is a storage area network (SAN) protocol, allowing organizations to consolidate storage into data center storage arrays while providing hosts (such as database and web servers) with the illusion of locally attached disks.
你可以移除它。
sudo apt remove open-iscsi -y --purge
/sbin/agetty --noclear tty1 linux
agetty - alternative Linux getty
getty, short for "get tty", is a Unix program running on a host computer that manages physical or virtual terminals (TTYs). When it detects a connection, it prompts for a username and runs the 'login' program to authenticate the user.
Originally, on traditional Unix systems, getty handled connections to serial terminals (often Teletype machines) connected to a host computer. The tty part of the name stands for Teletype, but has come to mean any type of text terminal.
它可以让你在物理机上登录进你的服务器。在Digital Ocean 上,你可以点击droplet 详情的Console,记着你应该可以在浏览器中和一个终端交互(认为它其实是一个VNC 连接)。
以前,你会看到一堆tty 在系统启动时启动(在/etc/inittab中配置),但是现在它们由Systemd 按需启动。
为了好玩,我移除了启动和生成agetty的配置文件:
sudo rm /etc/systemd/system/getty.target.wants/getty@tty1.service
sudo rm /lib/systemd/system/getty@.service
当我重启服务器之后,我还能够通过SSH 连接上,不过没法通过Digital Ocean web 终端登录。
- http://manpages.ubuntu.com/manpages/xenial/man8/getty.8.html
- https://en.wikipedia.org/wiki/Getty_(Unix)
- http://0pointer.de/blog/projects/serial-console.html
- http://unix.stackexchange.com/questions/56531/how-to-get-fewer-ttys-with-systemd
sshd: root@pts/0 & -bash & htop
sshd: root@pts/0表示用户root在#0号虚拟终端(pts)上建立了一个SSH 会话。一个虚拟终端模仿一个真正的文本终端。
bash 是我在用的shell。
为什么开头有一个破折号?Reddit 用户hirnbrot 很好的解释了:
There's a dash at the beginning because launching it as "-bash" will make it a login shell. A login shell is one whose first character of argument zero is a -, or one started with the --login option. This will then cause it to read a different set of configuration files.
htop是一个运行在截图中的交互式进程查看工具。
结束之后
sudo apt remove lvm2 -y --purge
sudo apt remove at -y --purge
sudo apt remove snapd -y --purge
sudo apt remove lxcfs -y --purge
sudo apt remove mdadm -y --purge
sudo apt remove open-iscsi -y --purge
sudo apt remove accountsservice -y --purge
sudo apt remove policykit-1 -y --purge
极限版:
sudo apt remove dbus -y --purge
sudo apt remove rsyslog -y --purge
sudo apt remove acpid -y --purge
sudo systemctl stop cron && sudo systemctl disable cron
sudo rm /etc/systemd/system/getty.target.wants/getty@tty1.service
sudo rm /lib/systemd/system/getty@.service
我按照我的博客文章about unattended installation of WordPress on Ubuntu Server 的步骤安装,成功了。
这是nginx,PHP7 和MySQL。
附录
源代码
有时候只看strace 是不够的。
另外一个找出一个程序到底做了什么是读它的源代码。
首先,我需要找到我们从哪里开始看。
$ which uptime
/usr/bin/uptime
$ dpkg -S /usr/bin/uptime
procps: /usr/bin/uptime
我们发现uptime实际上是位于/usr/bin/uptime,并且在Ubuntu 上它是proccps 软件包的一部分。
你可以到http://packages.ubuntu.com/ 上搜索这个软件包。
这是procps的页面:http://packages.ubuntu.com/source/xenial/procps
如果你滚动到页面底部,你会看到源代码库的链接:
- Debian Package Source Repository git://git.debian.org/collab-maint/procps.git
- Debian Package Source Repository (Browsable) https://anonscm.debian.org/cgit/collab-maint/procps.git/
文件描述符和重定向
当你想把标准错误输出(stderr)重定向到标准输出(stdout),是用2&>1 还是2>&1?
你可以通过认识到echo something > file将会写something到文件file中来记住&符号的位置。这和echo something 1> file一样。现在,echo something 2> file会把stderr 输出到file。
如果你写的是echo something 2>1,意味着你把stderr 重定向到一个叫1``的文件。加个空格看起来更清晰一些:echo something 2> 1`。
如果你在1前面加一个&,表示1不是一个文件名而是一个流ID。所以应该是echo something 2>&1。
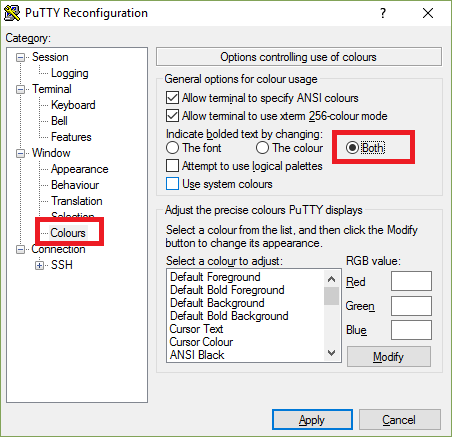
PuTTY 的颜色
如果你使用PuTTY 的时候,在htop 发现缺少一些彩色元素,下面是解决方法。
- 右击标题栏
- 点击Change settings...
- 跳到Window -> Colours
- 选择Both 单选按钮
- 点击应用
C 写的Shell
让我们用C 写一个非常简单的shell,显示下使用fork/exec/wait系统调用。这是程序shell.c。
#include <stdio.h>
#include <stdlib.h>
#include <unistd.h>
#include <string.h>
#include <sys/wait.h>

int main() {
    printf("Welcome to my shell\n");
    char line[1024];

    while (1) {
        printf("> ");

        fgets(line, sizeof(line), stdin);
        line[strlen(line)-1] = '\0'; // strip \n
        if (strcmp(line, "exit") == 0) // shell built-in
            break;

        int pid = fork();
        if (pid == 0) {
            printf("Executing: %s\n", line);
        if (execlp(line, "", NULL) == -1) {
            printf("ERROR!\n");
            exit(1);
        }
        } else if (pid > 0) {
            int status;
            waitpid(pid, &status, 0);
            printf("Child exited with %d\n", WEXITSTATUS(status));
        } else {
            printf("ERROR!\n");
            break;
        }
    }

    return 0;
}
编译程序:
gcc shell.c -o shell
接着运行:
$ ./shell
Welcome to my shell
> date
Executing: date
Thu Dec  1 14:10:59 UTC 2016
Child exited with 0
> true
Executing: true
Child exited with 0
> false
Executing: false
Child exited with 1
> exit
你有没有想过为什么运行一个后台程序的时候,只能在你按下Enter之后一会才能看到它退出了?
$ sleep 1 &
[1] 11686
$ # press Enter
[1]+  Done                    sleep 1
这是因为shell 一直唉等待你的输入。只有当你输入一个命令之后,它才会检查后台程序的状态,如果它们终止了就会显示出来。
TODO
这是我还想要了解的更加详细的。
- process state substatuses (
Ss,Ss+,R+, etc.) - kernel threads
/dev/pts- more about memory (
CODE,DATA,SWAP) - figure out time slices length
- Linux scheduler algorithm
- pinning proceses to cores
- write about manual pages
- cpu/memory colors in bars
- process ID limit & fork bomb
lsof,ionice,schedtool
更新
这是文章自发布以来较大的更正和更新列表。
- Idle time in
/proc/uptimeis the sum of all cores (Dec 2, 2016) - My parent/child
printfinzombie.cwas reversed (Dec 2, 2016) apt remove croninstallspostfixbecause of a dependency to an MTA (Dec 3, 2016)idcan load information from other sources (via/etc/nsswitch.conf), not just/etc/passwd(Dec 3, 2016)- Describe
/etc/shadowpassword hash format (Dec 3, 2016) - Use
visudoto edit the/etc/sudoersfile to be safe (Dec 3, 2016) - Explain
MEM%(Dec 3, 2016) - Rewrite the section about load averages (Dec 4, 2016)
- Fix:
kill 1234by default sendsTERMnotINT(Dec 7, 2016) - Explain CPU and memory color bars (Dec 7, 2016)
后记
如果这篇文章有错误请让我知道!我很乐意更正它。